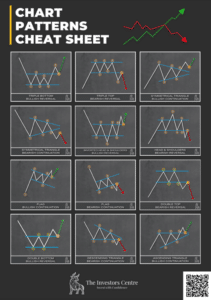
How to Download our Chart Patterns PDF?
- Click the link below.
- This will initiate your download.
- Please visit our Trading Chart Patterns page, which explains how to spot these patterns and how to trade them.
Featured Brokers

Spreadex
- Long and Short Trading
- Trade with Leverage
73% of retail CFD accounts lose money when trading CFD’s with this provider.
How to Use This Chart Pattern Cheat Sheet?
This chart pattern cheat sheet serves as a quick reference guide for identifying and trading key chart patterns. Start by familiarizing yourself with the various patterns and their characteristics, then apply the cheat sheet to your trading analysis. When analysing a chart, refer to the patterns on the cheat sheet to recognize potential market trends and reversals. Use it alongside technical indicators to confirm the validity of the patterns. This cheat sheet can help streamline your decision-making process, making it easier to spot profitable trading opportunities in real-time.
Disclaimer
Trading chart patterns are tools used in technical analysis to identify potential market trends and price movements. However, they do not guarantee success in trading and should not be relied upon as the sole basis for trading decisions. The effectiveness of chart patterns can vary depending on market conditions and individual interpretation. Always conduct thorough research and combine chart patterns with other forms of analysis, such as fundamental analysis and risk management strategies. Trading in financial markets carries risks, and you should only invest money that you can afford to lose. Consult a financial advisor if necessary.
Where Can I Trade Chart Patterns in the UK?
In the UK, traders have access to numerous reputable platforms for trading chart patterns. Some of the top platforms include:
72.3% of retail investors lose money when trading spread bets and CFDs with this provider.
Open an account and deposit £500 to get a 6 month gift subscription to the Financial Times.

IG
- Diverse trading tools
- Educational resources
- Wide market access
Don’t invest unless you’re prepared to lose all the money you invest. This is a high-risk investment and you should not expect to be protected if something goes wrong. Take 2 mins to learn more.
FAQs
Trading chart patterns are used in technical analysis to predict future price movements by analyzing historical price data. They help traders identify trends, reversals, and continuation patterns, providing insights into potential entry and exit points.
Yes, trading chart patterns can be applied across various markets, including stocks, forex, commodities, and cryptocurrencies. However, their effectiveness can vary depending on market conditions, volatility, and the asset being traded.
While chart patterns can provide valuable insights, they are not foolproof. The reliability of chart patterns depends on market conditions and proper confirmation through additional technical indicators. It’s essential to combine them with risk management strategies.
Most trading platforms offer built-in charting tools that allow you to identify and analyze chart patterns. You can also use specialized technical analysis software or online charting tools to enhance your analysis.
Continuation patterns suggest that the current trend will continue, while reversal patterns indicate a potential change in trend direction. Understanding the difference helps traders make more informed decisions about entering or exiting trades.

What are the UK Equivalents of Popular US Investment Funds in 2024?



How to Buy Berkshire Hathoway Shares (BRK) in the UK: 2024 Guide


How to Invest in IPOs on eToro in 9 steps: 2024 Best Practise Guide
Start trading CFDs with IG today—seize market opportunities!
Capital at Risk.


