What Is Forex Line Trading and How Can You Master It?

Thomas Drury
Co-Founder
Seasoned finance professional with 10+ years' experience. Chartered status holder. Proficient in CFDs, ISAs, and crypto investing. Passionate about helping others achieve financial goals.
Twitter ProfileAuthor Bio

Dom Farnell
Co-Founder
Dom, a Co-Founder at TIC, is an avid investor and experienced blogger who specialises in financial markets and wealth management. He strives to help people make smart investment decisions through clear and engaging content.
Twitter ProfileAuthor Bio
Fact Checked
How we test
At The Investors Centre, we pride ourselves on our rigorous fact-checking process. To delve deeper into our meticulous testing procedures and discover how we ensure accuracy and reliability, visit our dedicated page on how we test.
Risk Warning
Please bear in mind that trading involves the risk of capital loss. 51% to 84% of retail investor accounts lose money when trading CFDs with the providers below. You should consider whether you can afford to take the high risk of losing your money.
Last Updated 03/01/2025
Quick Answer:
Forex line trading involves using trend lines to identify and predict price movements in the forex market. Mastering this skill requires understanding trends, drawing accurate lines, and applying proven trading strategies for breakout or bounce opportunities.
FREE Charting Patterns Cheat Sheet
Featured Broker

Spreadex
- Spread Betting
- Competitive Spreads
- Trade With Leverage
- User Friendly
- Short the Pound
81% of retail investor accounts lose money when trading CFDs with this provider.
Open an account and deposit £500 to get a 6 month gift subscription to the Financial Times.
What Are Forex Line Trends and Why Do They Matter?
When I first started exploring Forex trading, understanding trends felt like unlocking a secret code. It wasn’t just about watching the numbers go up or down; it was about identifying patterns that could guide my decisions. Recognizing these trends gave me a framework for anticipating what might come next in the market—and that’s why they matter so much.
What Are the Different Types of Forex Trends?
In Forex trading, trends are the backbone of market analysis. They reflect the overall direction a currency pair’s price is moving over a specific time frame. Here are the three main types of trends I encountered early on:
1. Uptrend:
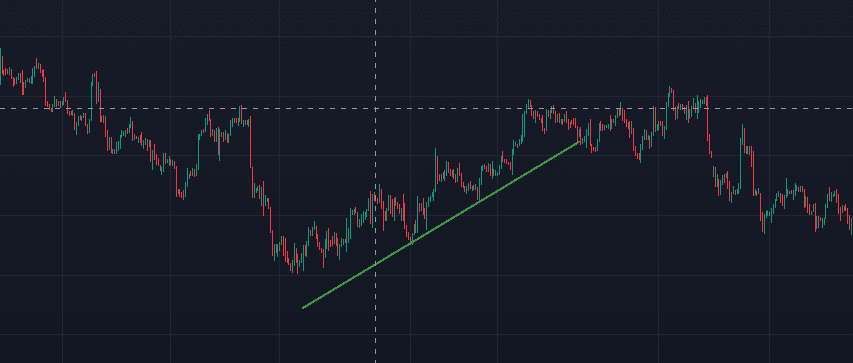
An uptrend occurs when prices are consistently rising, forming higher highs and higher lows. Think of it as a staircase moving upwards. In my experience, this is a great time to look for buying opportunities, especially if you’ve drawn a solid trend line that confirms the momentum.
- Example: When EUR/USD is in an uptrend, you might consider entering buy positions as the price continues climbing.
2. Downtrend:
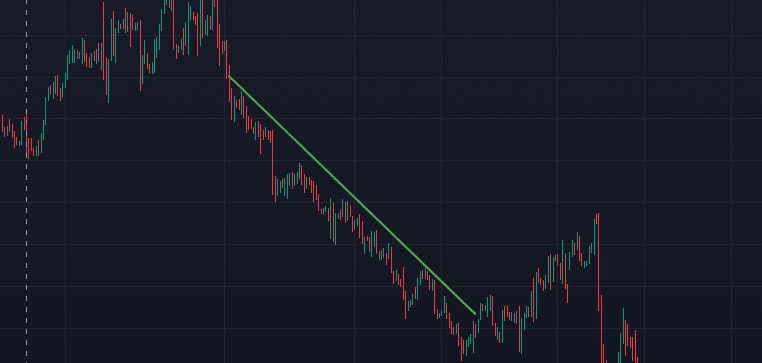
A downtrend is the opposite—it’s when prices are consistently falling, forming lower highs and lower lows. For me, downtrends have always been a signal to look for selling opportunities.
- Example: If GBP/USD is in a downtrend, entering sell positions might align with the market direction.
3. Sideways Trend:
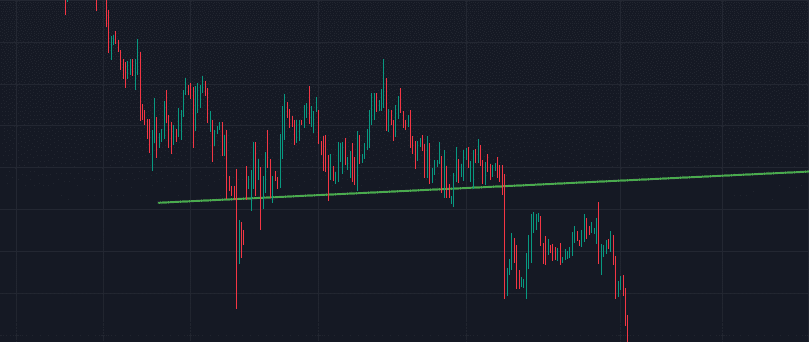
This one used to frustrate me as a beginner. A sideways trend happens when prices move within a range, neither climbing nor falling significantly. It often indicates market indecision. My lesson? Wait for a breakout before committing to a position.
- Example: If USD/JPY is trading sideways, patience pays off as you wait for a breakout above or below the range.
How Do Trend Lines Help Predict Market Movements?
For me, trend lines felt like drawing a roadmap. These lines connect the dots—literally, by linking significant highs or lows on a chart. They provide a visual guide to the market’s direction, helping me make informed decisions rather than guessing.
Here’s why they’re so powerful:
- Identify Support and Resistance: A well-drawn trend line can highlight key levels where the price might bounce or break through. I’ve seen this play out countless times, where the market respects a trend line as a psychological barrier.
- Spot Reversals or Continuations: If the price breaks through a trend line, it can signal a potential reversal. Conversely, if the price bounces off the line, it may indicate a continuation of the current trend.
- Simplify Decision-Making: Instead of overanalysing every candlestick, trend lines offer clarity. They let you focus on the bigger picture, which was a game-changer for me.
| Trend Type | Definition | Example Usage in Forex |
|---|---|---|
| Uptrend | Price consistently rising | Enter buy positions |
| Downtrend | Price consistently falling | Enter sell positions |
| Sideways Trend | Price moving horizontally | Wait for breakout |
By learning to recognize and apply these trends, I’ve found that trading becomes less about luck and more about logic. Trends tell a story—and when you know how to read that story, you’re already ahead of the game.
How Do You Draw and Validate Forex Trend Lines?
Drawing trend lines was one of the first skills I picked up when I started trading Forex. At first, it felt like an art form—almost subjective—but with practice, I realized it’s grounded in clear, actionable principles. Here’s what I’ve learned about drawing and validating these essential tools.
How Do You Locate Trend Movements on a Chart?
The first step to drawing trend lines is recognizing the overall trend. Is the market heading up, down, or sideways? When I was starting out, this felt overwhelming—like trying to see a pattern in chaos. But over time, I found some techniques that made it easier:
- Zoom Out First: I always start by zooming out to get a broader view of the market. It’s like stepping back from a painting to see the full picture.
- Look for Patterns: Uptrends form higher highs and higher lows, while downtrends form lower highs and lower lows. Sideways trends, meanwhile, bounce within a range. Identifying these patterns simplifies the process.
- Use Multiple Time Frames: Checking the trend across daily, hourly, and even 15-minute charts provides context. For example, the daily chart might show a long-term uptrend, while the hourly chart reveals short-term corrections.
Pro Tip: I’ve learned to avoid forcing a trend where there isn’t one. If the price action looks too choppy, it might just be a range-bound market.
What’s the Best Way to Connect Highs and Lows?
Once I’ve identified the trend, the next step is connecting the dots. Trend lines are essentially drawn by linking key highs or lows, depending on the direction of the trend. Here’s my approach:
- For an Uptrend: Connect two or more higher lows to create a line that slopes upwards. This line acts as a support level.
- For a Downtrend: Connect two or more lower highs to draw a line that slopes downwards, which serves as resistance.
- Be Precise: Focus on significant price points rather than minor fluctuations. I use candlestick wicks for the most accurate representation.
I remember my first attempt at drawing trend lines—my chart ended up looking like a spider web. Over time, I learned that simplicity is key. A clean, well-drawn trend line is far more effective than dozens of messy ones.
How Do You Validate Trend Lines for Reliability?
Drawing a trend line is just half the battle; validating it ensures you’re not relying on a weak or meaningless line. Here’s what I do to confirm reliability:
- Test Support and Resistance: A good trend line should show multiple price reactions. For example, if a line drawn in an uptrend consistently acts as a support level, it’s likely valid.
- Check Volume: High trading volume near the trend line often indicates its significance.
- Use Historical Data: I often back test my trend lines by looking at past price movements. If the trend line aligns with historical price behaviour, I feel more confident in its accuracy.
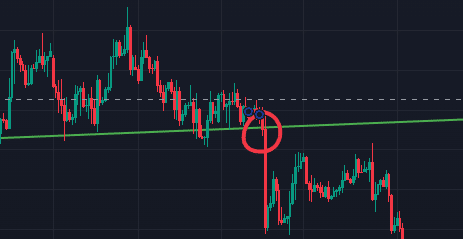
- Beware of Breakouts: A trend line break doesn’t necessarily mean the trend has reversed. I usually wait for confirmation, like a candlestick close beyond the line, before making decisions.
One mistake I used to make was relying on a single point of validation. Over time, I realized that combining multiple techniques gave me a clearer and more reliable picture.
Steps to Draw Forex Trend Lines
Here’s a summary of the process:
| Step | Description | Tools Needed |
|---|---|---|
| Locate Trend | Identify up, down, or sideways movement | Charting software |
| Connect Points | Link consecutive highs or lows | Drawing tool |
| Validate | Confirm accuracy using price reactions | Historical data |
Drawing and validating trend lines isn’t just a technical exercise—it’s a skill that blends observation and practice. I’ve found that the more time I spend refining these lines, the better they guide my trades. Trend lines are like a compass, pointing you in the direction the market wants to go. And trust me, when you get it right, it feels like you’re navigating with precision instead of guesswork.
How Can You Use Forex Trend Lines to Track Market Movements?
When I first began trading Forex, I thought drawing a trend line was a “set it and forget it” process. But experience taught me that trend lines are dynamic tools that evolve with the market. Tracking market movements with trend lines involves two crucial elements: selecting the right time frame and refining the lines as new data emerges.
Why Is Time Frame Selection Important?
The time frame you choose for your trend analysis can make or break your trading decisions. I learned this the hard way when I first tried to apply a trend line from a 5-minute chart to a long-term trade—it didn’t end well. Here’s how I approach time frames now:
- Short-Term Charts (5-minute to 1-hour):
- Best for scalping or day trading.
- These charts show quick price movements and are useful for capturing small, frequent profits.
- In My Experience: I use short-term charts to identify immediate opportunities but pair them with longer time frames for confirmation.
- Medium-Term Charts (4-hour to daily):
- Ideal for swing trading or holding positions for a few days to weeks.
- They provide a balance between detail and broader market context.
- Example: I often draw trend lines on 4-hour charts and refine them using daily charts.
- Long-Term Charts (weekly to monthly):
- Essential for identifying the overall market direction and major support/resistance levels.
- Pro Tip: Long-term charts help me avoid getting caught up in short-term noise and stay aligned with the bigger picture.
Choosing the right time frame depends on your trading style. When I was learning, I realized that mismatched time frames often led to confusion and missed opportunities.
How Do You Analyse and Refine Trend Lines Over Time?
Market conditions change constantly, and trend lines that were accurate yesterday might not hold true tomorrow. Refining trend lines as new data comes in is crucial. Here’s how I do it:
- Reassess After Major Price Moves:
- If the price breaks a trend line or creates new highs/lows, I redraw the line to reflect the updated market structure.
- Example: During a strong uptrend, new higher lows may emerge, requiring a steeper trend line.
- Check for Confluence:
- I often align trend lines with other indicators like moving averages or Fibonacci levels. If multiple tools confirm the trend, it boosts my confidence.
- Adjust for Time Frame Changes:
- A trend line that looks perfect on a daily chart might not align with a 4-hour chart. I tweak lines to ensure they make sense across the time frames I’m analysing.
- Keep It Clean:
- I used to clutter my charts with too many trend lines, which led to indecision. Now, I focus on drawing the most relevant lines and updating them regularly.
Refining trend lines is an ongoing process, but it’s one that pays off. Over time, I’ve found that consistently updating my lines keeps me in sync with the market’s rhythm. Whether it’s tracking a gradual uptrend or anticipating a breakout, trend lines are like a living map that evolves alongside the market, helping me navigate the complexities of Forex trading with clarity and confidence.
What Are the Top Strategies for Trading Forex with Trend Lines?
Trend lines are more than just visual aids—they’re actionable tools that can guide your trading decisions. When I first started using them, I was amazed at how simple yet powerful they were for identifying opportunities. Over time, I’ve honed three key strategies that every trader should understand: breakouts, bounces, and day trading with trend lines.
How Do Trend Line Breakouts Work?
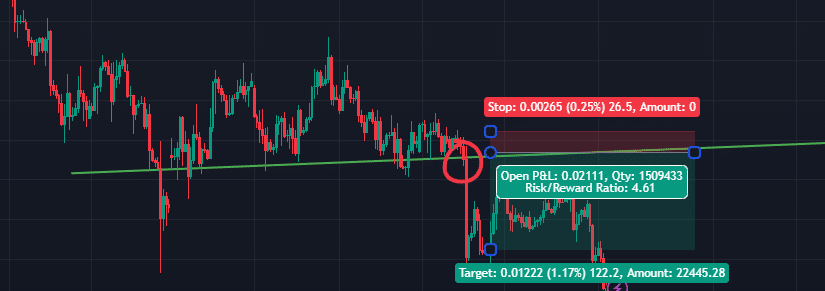
A trend line breakout occurs when the price moves beyond a well-established trend line, signalling a potential reversal or a significant shift in momentum. I still remember the first breakout trade I attempted—it was nerve-wracking but exhilarating when it worked out. Here’s how I approach breakouts:
1. Identify the Breakout:
- Watch for a strong price movement through the trend line, accompanied by high trading volume.
- Example: If the price breaks above a downward trend line, it could signal the start of an uptrend.
2. Confirm the Breakout:
- I always wait for a candlestick close beyond the trend line before entering a trade. False breakouts are common, and this simple rule saves me from unnecessary losses.
3. Set Entry and Exit Points:
- Entry: Place an order just above or below the breakout point, depending on the trend’s direction.
- Exit: Use a stop-loss below the breakout point and a take-profit at the next significant resistance or support level.
In My Experience: Breakout trades require patience and discipline. I’ve learned not to chase a breakout that’s already too far from the trend line—waiting for a pullback often yields better results.
What Are Trend Line Bounces and How Do You Trade Them?
Bounce trading involves entering a position when the price touches a trend line and rebounds in the direction of the prevailing trend. This strategy has been one of my go-to methods because it offers clear risk-reward setups.
- Spot the Bounce:
- Look for the price to approach a trend line and form a reversal pattern, such as a pin bar or engulfing candlestick.
- Example: In an uptrend, if the price touches the trend line and forms a bullish candlestick, it’s a potential buy signal.
- Set Up the Trade:
- Entry: Place an order just above the reversal candlestick for uptrends, or below it for downtrends.
- Stop-Loss: Position your stop-loss slightly beyond the trend line to account for potential false touches.
- Take-Profit: Target the previous high in an uptrend or the previous low in a downtrend.
- Confirm with Indicators:
- I often pair bounce trades with indicators like RSI to ensure the market isn’t overbought or oversold.
Pro Tip: Bounce trades work best in strong, clearly defined trends. I’ve found that weaker trends often lead to the price breaking through the line instead of bouncing.
Can Trend Lines Be Used Effectively for Day Trading?
Absolutely. Day trading with trend lines is all about leveraging short-term price movements. Here’s how I use them for quick, decisive trades:
- Focus on Short Time Frames:
- I use 5-minute or 15-minute charts to identify micro-trends within the larger market context.
- Example: If a trend line forms on a 15-minute chart, I monitor it closely for breakouts or bounces during the session.
- Prioritize Liquidity:
- Currency pairs with high liquidity, like EUR/USD or GBP/USD, are ideal for day trading. Their consistent price action makes trend lines more reliable.
- Set Tight Risk Parameters:
- Since day trading involves quick decisions, I keep my stop-loss and take-profit levels close to the entry point. This helps manage risk effectively.
- Be Prepared to Exit Quickly:
Unlike swing or position trading, day trading demands rapid responses. I always monitor my trades closely and adjust as needed.
Trend Line Trading Strategies
| Strategy | Description | Example Setup |
|---|---|---|
| Breakouts | Trade when price breaks a trend line | Stop-loss below line |
| Bounces | Enter trades at trend line touches | Target previous high |
| Day Trading | Use short time frames for quick trades | High-frequency charts |
Each of these strategies has its own strengths and nuances. Over time, I’ve found that combining them with disciplined risk management and thorough market analysis helps me trade with confidence. Whether you’re targeting breakouts, bounces, or short-term moves, trend lines offer a roadmap to navigate the ever-changing Forex market.
How Can You Extend and Adapt Trend Lines for Long-Term Success?
When I first started trading, I viewed trend lines as static tools—draw them once, and they’re good forever. But as I gained experience, I realized that trend lines are dynamic, adapting to the market’s ebb and flow. Extending and refining these lines is essential for long-term success.
What Are My Final Tips for Forex Line Trading Beginners?
When I first dipped my toes into Forex trading, the learning curve felt steep. But with time, I discovered a few principles that kept me on track. Here are my top tips for those just starting out:
How Can You Avoid Common Mistakes?
- Don’t Let Emotions Drive Your Trades:
- One of my earliest mistakes was chasing losses after a bad trade. Staying calm and sticking to your strategy is crucial.
- Pro Tip: I keep a trading journal to review decisions objectively and avoid repeating emotional errors.
- Avoid Overtrading:
- It’s tempting to enter trades frequently, but not every price movement warrants action. Quality over quantity is key.
- Example: I learned to wait for strong confirmations before entering trades, even if it meant sitting on the sidelines for a while.
- Stick to a Risk Management Plan:
Setting clear stop-loss and take-profit levels has saved me from significant losses. Risk only what you can afford to lose—no exceptions.
What’s the Key to Long-Term Success in Forex Line Trading?
- Commit to Continuous Learning:
- Markets are always evolving, and so should your knowledge. I regularly revisit my strategies and explore new ones to stay sharp.
- Example: Watching webinars and reading books helped me refine my use of trend lines over time.
- Practice, Practice, Practice:
- There’s no substitute for hands-on experience. Demo accounts are great, but I found that trading with real money (even small amounts) taught me discipline and emotional control.
- Stay Disciplined:
- It’s easy to deviate from your plan in the heat of the moment. Discipline is the foundation of consistent success.
Final Thought: Forex line trading isn’t about being perfect—it’s about learning from every trade, refining your approach, and staying committed to improvement. With patience and practice, you’ll develop the confidence and skills needed to navigate the market successfully.
FAQs
Forex line trading involves analysing the movement of currency prices within a chart to predict future trends. It uses support and resistance lines to make trading decisions.
Support and resistance lines are drawn by connecting the highs and lows of currency price charts. These lines help identify potential buy or sell points based on previous price actions.
Yes, beginners can engage in Forex line trading, but it’s essential to understand the basics of chart analysis and market trends first. Many online courses and trading simulators are available to practice.
Essential tools for Forex line trading include a reliable trading platform, access to real-time market data, charting software with drawing tools, and possibly indicators like moving averages to confirm trends.
To improve your Forex line trading skills, consistently practice on demo accounts, stay updated with global economic news, analyse successful trading strategies, and perhaps seek mentorship from experienced traders.
References:
Here are some high-authority resources for more in-depth information on forex trading and the British Pound:
- Investopedia – Understanding Forex https://www.investopedia.com/articles/forex/11/why-trade-forex.asp
- Bank of England – Official Publications – https://www.bankofengland.co.uk/news/publications
- Trading Economics – GBP Historical Data – https://tradingeconomics.com/currencies?base=gbp
Featured Blogs
Trade Forex with SpreadEX
81% of retail investor accounts lose money when trading CFDs with this provider.

