
11 Trading Chart Patterns Every Trader Needs To Know 2025

Adam Woodhead
Co-Founder
Adam is a Co-Founder and content creator for The Investors Centre. His key areas of interest and expertise are ETF's and blockchain technology.
Twitter ProfileAuthor Bio

Dom Farnell
Co-Founder
Dom, a Co-Founder at TIC, is an avid investor and experienced blogger who specialises in financial markets and wealth management. He strives to help people make smart investment decisions through clear and engaging content.
Twitter ProfileAuthor Bio
Fact Checked
How we test
At The Investors Centre, we pride ourselves on our rigorous fact-checking process. To delve deeper into our meticulous testing procedures and discover how we ensure accuracy and reliability, visit our dedicated page on how we test.
Risk Warning
Please bear in mind that trading involves the risk of capital loss. 51% to 84% of retail investor accounts lose money when trading CFDs with the providers below. You should consider whether you can afford to take the high risk of losing your money.
Last Updated 24/04/2025
In this post, I’ll walk you through the essential chart patterns every aspiring trader should know. Once you get the hang of these, you’ll be able to level up your technical analysis, make smarter trading decisions, and boost your chances of success in the markets.
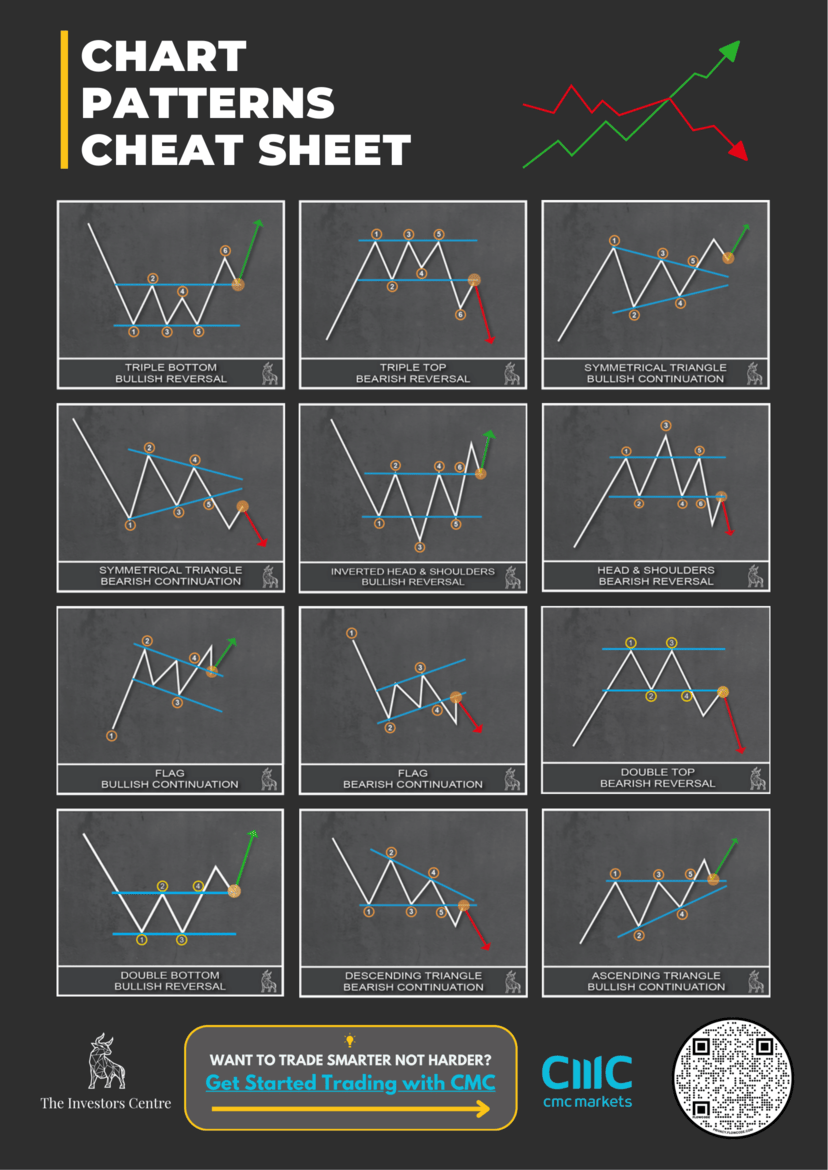
Here are the Top Trading Chart Patterns Traders Should Know in 2025:
FREE Charting Patterns Cheat Sheet
Where Can I Trade Chart Patterns in the UK?
In the UK, traders have access to numerous reputable platforms for trading chart patterns. Some of the top platforms include:
CMC Markets
- Diverse trading tools
- Educational resources
- Wide market access
70% of retail investor accounts lose money when trading CFDs with this provider. You should consider whether you can afford to take the high risk of losing your money.
SpreadEX
- Spread Betting
- Competitive Spreads
- Trade With Leverage
- User Friendly
81% of retail investor accounts lose money when trading CFDs with this provider. You should consider whether you can afford to take the high risk of losing your money.
Open an account and deposit £500 to get a 6 month gift subscription to the Financial Times.
What is a Trading Chart Pattern?
A graphical representation of price movements in the financial markets, formed by historical price data plotted on a chart.
These patterns help traders predict future market movements based on past price behavior. They are crucial for technical analysis, providing insights into market sentiment and potential price direction. Understanding these patterns can enhance a trader’s ability to make informed decisions, optimise entry and exit points, and manage risk effectively.
What Are the Main Types of Chart Patterns?
Most chart patterns fall into three main categories: continuation, reversal, and bilateral.
Continuation patterns signal that the current trend is likely to keep going. Think of flags, pennants, and symmetrical triangles. These usually show up during short pauses in the market before momentum picks back up.
Reversal patterns hint that a trend might be coming to an end. Classic examples include head and shoulders, double tops, and double bottoms. When these form, it’s often a sign the market’s about to change direction.
Bilateral patterns are a bit more unpredictable — they can break either way. A symmetrical triangle, for example, shows price squeezing into a tight range, and when it finally breaks out, it could go up or down.
The Top 11 Top Trading Chart Patterns
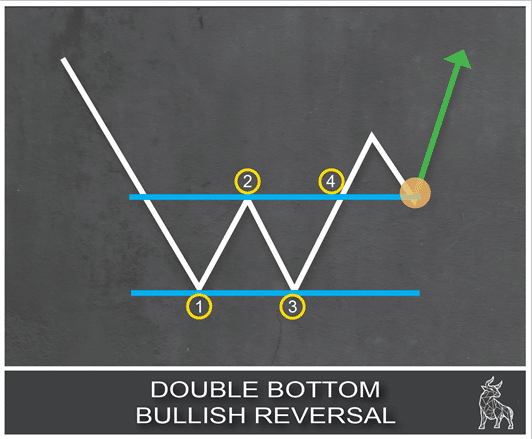
1. Double Bottom
The Double Bottom is a classic bullish reversal pattern that forms after a downtrend. It features two sharp lows at roughly the same level, separated by a peak. This shows strong support and signals that sellers are losing steam while buyers are stepping in.
How to trade it:
Enter on a breakout above the middle peak. Set your stop-loss just below the lowest low, and aim for a profit target equal to the height from the low to the peak.

2. Double Top
The Double Top is a bearish reversal pattern that shows up after an uptrend. It forms when price hits the same resistance level twice, with a dip in between. This signals that buying momentum is fading and sellers are starting to take control.
How to trade it:
Enter when price breaks below the middle trough. Place a stop-loss just above the highest peak, and target a drop equal to the height from the peak to the trough.

3. Triple Bottom
The Triple Bottom is a bullish reversal pattern that marks the end of a downtrend. It forms with three clear lows at a similar level, separated by two modest peaks. This signals strong support and repeated failure by sellers to break lower.
How to trade it:
Go long when price breaks above the highest of the two peaks. Place your stop-loss below the lowest low, and set your target based on the distance from the low to the peak.

4. Triple Top
The Triple Top is a bearish reversal pattern that signals a potential trend change. It forms with three peaks around the same level, divided by two troughs—indicating strong resistance and waning buyer momentum.
How to trade it:
Enter short when price breaks below the lowest trough. Place your stop-loss just above the highest peak, and aim for a move equal to the height from the peak to the trough.

5. Inverted Head and Shoulders
The Inverted Head and Shoulders is a bullish reversal pattern that often marks the end of a downtrend. It forms with three lows—the middle one (the head) being the lowest, flanked by two higher lows (the shoulders). It shows growing buying pressure and weakening sellers.
How to trade it:
Enter on a breakout above the neckline (the resistance across the shoulders’ peaks). Set your stop just below the head, and target a move equal to the distance from the head to the neckline.

6. Head and Shoulders
The Head and Shoulders is a classic bearish reversal pattern that often signals the end of an uptrend. It forms with three peaks—the middle one (the head) being the highest, with two lower peaks on either side (the shoulders). It reflects rising selling pressure and fading buyer strength.
How to trade it:
Enter short when price breaks below the neckline (support across the shoulders’ troughs). Set your stop just above the head, and target a move equal to the distance from the head to the neckline.

7. Ascending Triangle
The Ascending Triangle is a bullish continuation pattern marked by rising lows and a flat resistance level. It shows buyers stepping up with increasing pressure, often leading to an upward breakout.
How to trade it:
Enter when price breaks above the resistance line. Place your stop just below the most recent higher low, and aim for a target equal to the triangle’s height at its widest point.

8. Descending Triangle
The Descending Triangle is a bearish continuation pattern with a flat support line and a descending resistance line. It signals mounting selling pressure and a likely downside breakout.
How to trade it:
Enter short on a break below support. Set your stop just above the most recent lower high, and aim for a target equal to the triangle’s height.

9. Symmetrical Triangle
The Symmetrical Triangle is a neutral (bilateral) pattern, where converging trend lines show price tightening between higher lows and lower highs. It’s a pause before a breakout—but the direction isn’t clear until it happens.
How to trade it:
Trade the breakout—go long if it breaks up, short if it breaks down. Set your stop just outside the opposite side of the triangle, and target a move equal to its height.
10. Flags
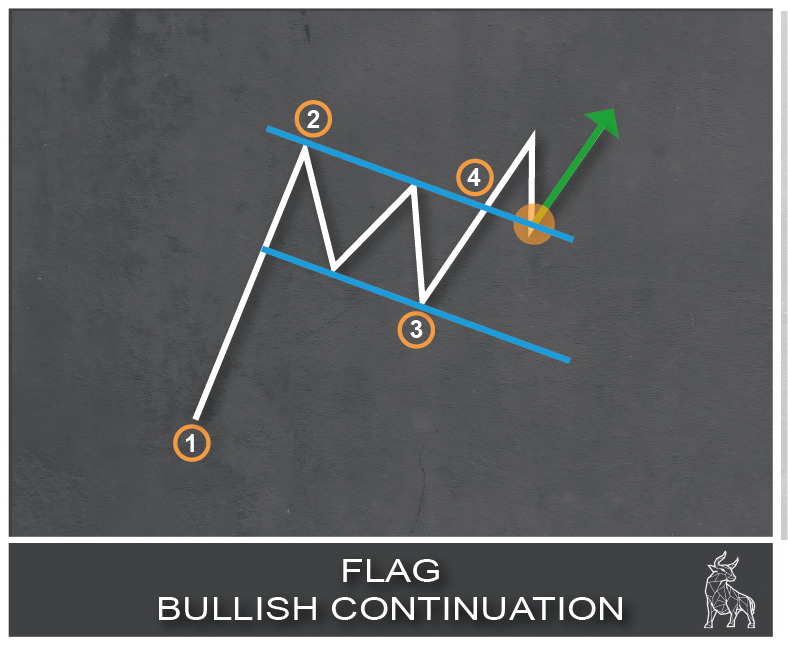

Flags are bullish or bearish continuation patterns that show up after a sharp price move, followed by a brief pullback. The flag itself forms between two parallel lines that slope against the trend—essentially a pause before momentum resumes.
How to trade it:
Enter on a breakout in the direction of the original trend. Set your stop just outside the opposite side of the flag, and target a move equal to the length of the flagpole.
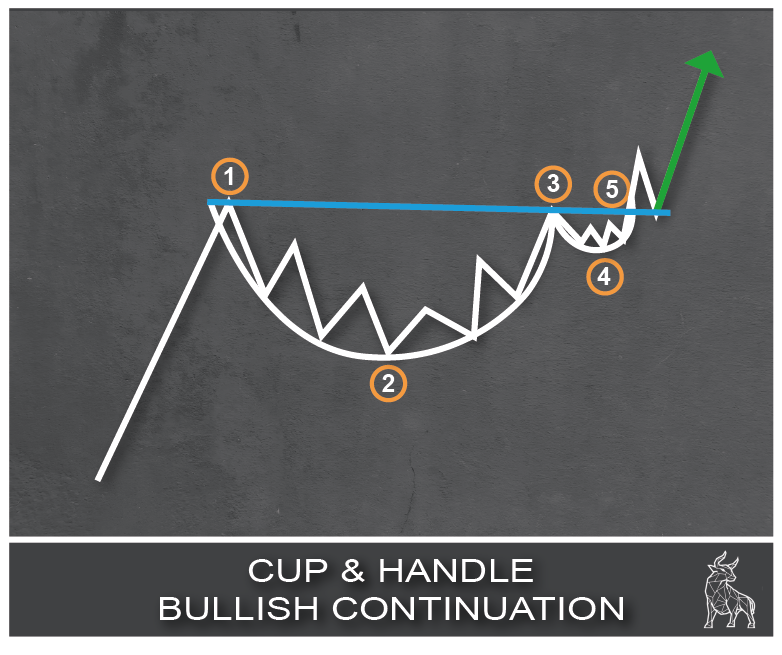
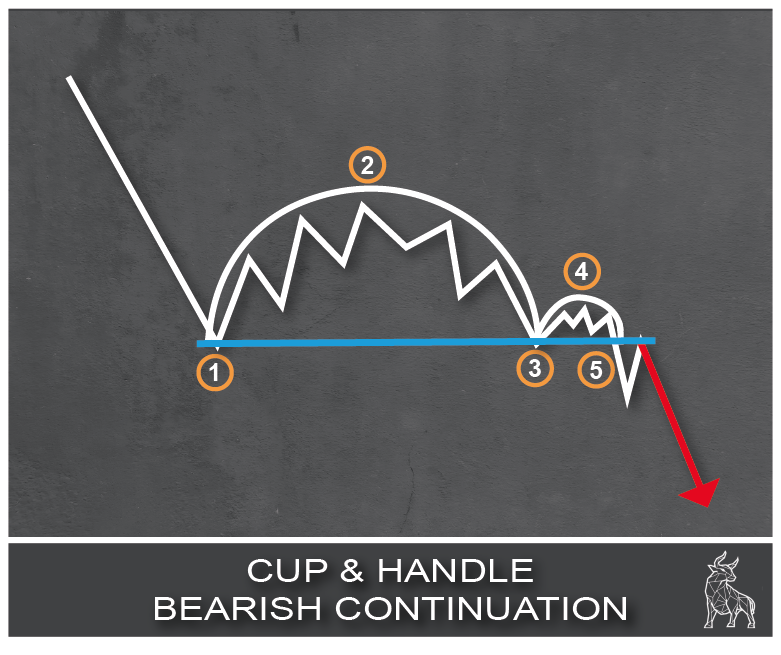
11. Cup and Handle
The Cup and Handle is a bullish continuation pattern shaped like—you guessed it—a tea cup. It starts with a rounded bottom (the cup), followed by a slight dip (the handle). It signals accumulation before a breakout.
How to trade it:
Buy when price breaks above the cup’s rim. Set your stop just below the handle’s low, and aim for a target equal to the cup’s depth.
FREE Charting Patterns Cheat Sheet -
How to Trade Using Chart Patterns (Step by Step)
- Spot the Pattern: Look for clear formations like double tops, triangles, or head and shoulders. Wait for the pattern to fully form.
- Confirm It: Use indicators like volume, moving averages, or RSI to validate the setup. Rising volume often supports the pattern.
- Set Entry Points: Enter long when price breaks above resistance (bullish) or short when it breaks below support (bearish).
- Place a Stop-Loss: Manage risk by placing stop-loss orders—below support for bullish trades, above resistance for bearish ones.
- Target Profits: Measure the height of the pattern and project it from the breakout point to set your profit target.
- Track the Trade: Monitor price action and adjust your stop-loss to protect profits.
- Exit Smartly: Close the trade at your target or if the pattern fails.
What is the Role of Support and Resistance in Chart Patterns?
Support and resistance are key to reading chart patterns. They highlight where price tends to stall, reverse, or break out.
- Support: A price floor where buying interest often halts a downtrend.
- Resistance: A price ceiling where selling pressure can stop an uptrend.
These levels often align with past highs and lows, as traders remember them and act accordingly when prices revisit.
How Do Support and Resistance Tie into Chart Patterns?
Many chart patterns form around key support and resistance zones.
Reversal patterns, like Double Tops and Head & Shoulders, tend to develop near these levels before the price changes direction.
Continuation patterns, such as Flags and Triangles, typically consolidate between support and resistance before the trend picks back up.
Then there are bilateral patterns, like Symmetrical Triangles, which reflect market indecision and can break out in either direction. Mastering how price behaves around these levels can significantly improve your ability to spot breakout and reversal opportunities with more confidence.
Confirming Chart Patterns with Breakouts
Breakouts confirm whether a chart pattern is valid:
- Bullish Breakout: Price breaks above resistance with strong volume, signaling potential upward momentum.
- Bearish Breakout: Price falls below support on high selling volume, suggesting a likely downtrend.
- False Breakouts: Price briefly breaks a level but quickly reverses. Use volume, moving averages, and RSI to avoid these traps.
Pairing breakouts with indicators helps confirm trends and improves trade timing.
The Psychology Behind Support and Resistance
Support and resistance levels don’t just mark price zones—they reflect trader psychology. Market memory plays a key role, as traders remember past turning points and react when prices return to those levels. Fear and greed also influence behavior: resistance can trigger profit-taking, while support tends to attract buyers hunting for value. Additionally, stop-loss clusters around these levels can fuel momentum during breakouts. Understanding this psychological layer adds depth to your technical analysis and helps you make sharper trading decisions.
Why Does Volume Matter in Chart Patterns?
Volume is one of the most important clues in technical analysis, expecially when it comes to confirming chart patterns. A volume spike during a breakout usually shows strong market conviction—it tells you that the move has real backing and could lead to trend acceleration. But if volume drops off during a breakout, that’s a red flag. It could signal weak participation and cast doubt on the price movement’s significance.
That’s why smart traders pay close attention to the price-volume relationship, using volume indicators and filters, and keep an eye on things like volume divergence, which can hint at a possible reversal.
TLDR? Volume is what helps you tell the difference between a legit setup and a false signal.
How reliable are these Chart Patterns?
While chart patterns are widely used in technical analysis, their reliability varies based on historical success rates. Studies on technical patterns have found that:
| Chart Pattern | Estimated Success Rate | Notes |
|---|---|---|
| Head & Shoulders | ~75–80% | More reliable when volume confirms the breakout |
| Double Tops/Bottoms | ~65–70% | Good for spotting reversals |
| Triangles | ~60–70% | Accuracy improves with strong breakout volume |
| Flags & Pennants | Up to 80% | Highly effective in strong trending markets |
While useful, patterns work best when paired with other technical indicators like RSI, MACD, or moving averages to increase their accuracy and reduce risk.
What are the Limitations of Chart Patterns?
Tracking chart patterns, while useful, is not bulletproof. They can be subjective—different traders might interpret the same pattern in different ways. False breakouts are a common risk, where price briefly breaks a key level only to reverse, catching traders off guard. In volatile markets, noise can lead to misleading setups, and since chart patterns are based on historical price action, they tend to lag behind real-time market shifts. To manage these risks, it’s smart to combine pattern analysis with momentum indicators, trend confirmation, and even a bit of fundamental analysis.
What External Factors Can Affect Chart Patterns?
Chart patterns don’t exist in a vacuum—external conditions matter:
- Trend Strength: Patterns work best during strong trends, where breakouts are more likely to follow through.
- Market Sentiment: News, earnings, or global events can disrupt technical setups.
- Liquidity & Volume: High-liquidity markets yield cleaner patterns; low liquidity often leads to erratic moves.
- Time Frames: Higher time frames (daily/weekly) tend to produce more reliable patterns than noisy, lower ones.
Factoring in these elements can improve accuracy and help traders adapt to changing markets.
Final Thoughts and FREE Charting Patterns Cheat Sheet
We’ve covered 11 key chart patterns every trader should know in 2025—what they look like, how to trade them, and when to trust them. Mastering these patterns can give you an edge in spotting opportunities and managing trades with more confidence.
Apply what you’ve learned on your platform of choice, and remember: always use solid risk management strategies and stay informed.
You can find our free Charting Patterns cheat sheet here: Download PDF
FAQ
The Double Bottom is a solid starting point. It’s easy to spot and signals a trend reversal from down to up—great for learning the ropes.
Use indicators like volume, moving averages, and RSI. A breakout with strong volume adds confidence. Waiting for price to break key levels helps confirm the setup.
Common risks include false breakouts and misreading patterns. To manage this, use stop-loss orders and stick to sound risk management.
They work best in trending markets. In sideways or volatile markets, patterns often give false signals, so adjust your approach accordingly.
Measure the pattern’s height and project that from the breakout point. For example, with a Double Bottom, measure from the low to resistance, then extend that upward.
References
- Bulkowski, Thomas N. (2005). Encyclopedia of Chart Patterns (2nd Edition). John Wiley & Sons. – A definitive book offering statistical performance analysis of over 60 chart patterns.
- Nison, Steve. (1991). Japanese Candlestick Charting Techniques. New York Institute of Finance. – With a focus on candlesticks, it offers foundational knowledge that ties into chart pattern interpretation.
- TradingView – Ideas and Scripts
- StockCharts – ChartSchool: Technical Analysis
- Fidelity – Technical Analysis: Chart Patterns
- MetaTrader 4/5 – Trading Pattern Tools and Plugins
- eToro Academy – Technical Analysis Guide
Related Blogs
70% of retail investor accounts lose money when trading CFDs with this provider. You should consider whether you can afford to take the high risk of losing your money.
- Wide range of markets
- Powerful Next Generation platform
- Advanced charting tools
- Customizable risk management
- Fast and reliable execution